European location intelligence
Know what is changing in a region before you are asked.
EU Optikos fuses statistical, event, infrastructure, and governance data into one citation-grounded view, resolved to NUTS-3, with deep statistical coverage across all 27 EU member states and wider European geography onboarding. Every claim traces to an upstream record.
EU data residency
A European hosting provider in Germany
No training on your data
The AI provider's commercial API terms
Austrian ECG §5 compliant
Socintel FlexKapG, Vienna
6 authoritative sources
Verbatim attribution
The problem
Regional intelligence is scattered. Your analysts pay the price.
Official European statistical data publishes quarterly. Geocoded event data updates hourly. Border-agency reporting is monthly. Your analysts reconcile these timelines manually: different formats, different granularities, different coordinate systems.
When the briefing reaches the decision-maker, the question is always the same: where did this number come from? If the answer is “the analyst’s spreadsheet,” trust erodes.
AI tools promise to help, but generate confident-sounding text with no citation trail. One hallucinated statistic in a ministerial brief can end a career.
The solution
One platform, three operating commitments.
Fused intelligence, one query
Ask about a region. Receive statistical indicators, live events, infrastructure features, governance scores, border data, humanitarian alerts, and enforcement signals, resolved to NUTS-3, cited to source.
AI that shows its work
Every AI-generated briefing, hazard & exposure assessment, and digest carries citation markers linking each claim to the specific observation that supports it. No claim without a receipt.
Analyst-ready, not analyst-replacing
The platform prepares the material. The analyst makes the judgement. Saved views, watchlists, configurable alerts, and exports: ready for the briefing chain.
How it works
Region in. Briefing out. Citation trail intact.
Step 01
Select a region
Search or click any of 1,541 NUTS regions across 40 European countries, down to NUTS-3 districts. The profile loads instantly.
Step 02
See the full picture
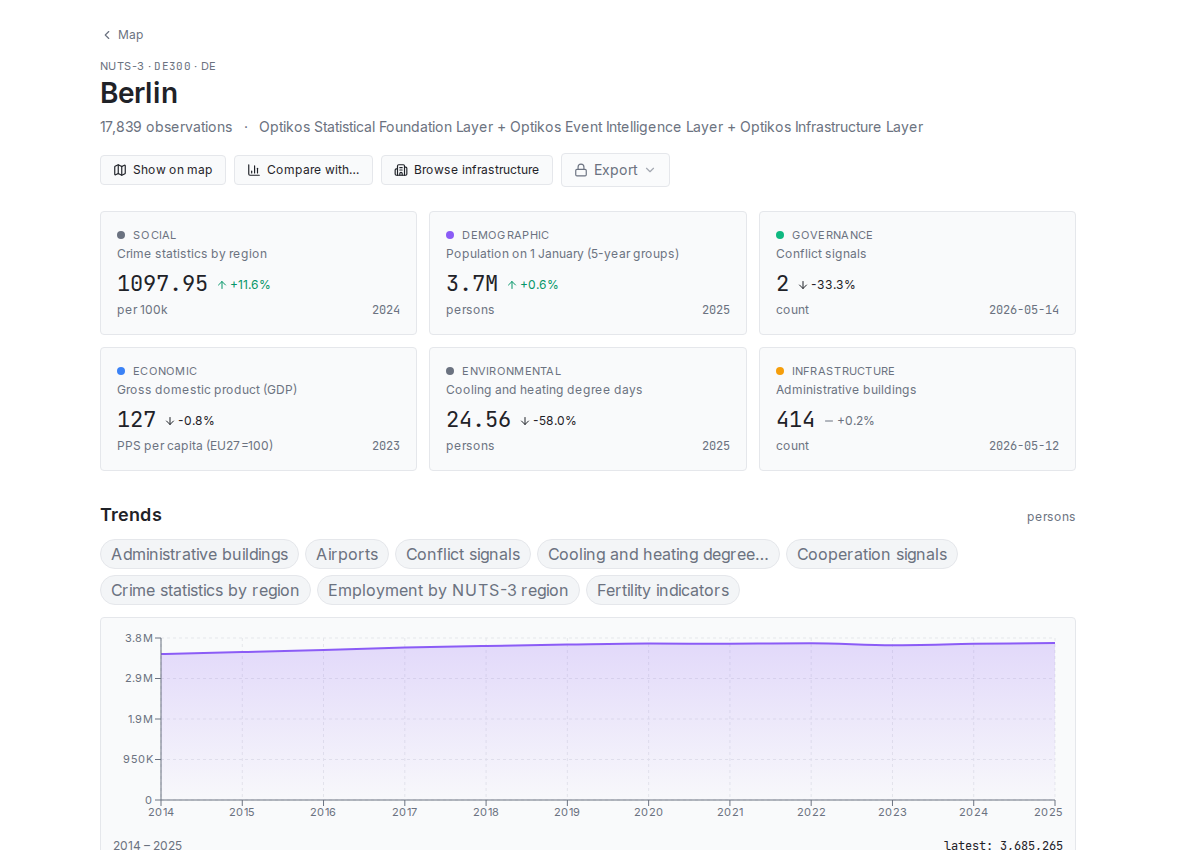
Statistical trends, live events, infrastructure, governance quality, border activity, enforcement signals: all on one screen, all cited.
Step 03
Generate or export
Request an AI briefing, hazard & exposure assessment, or event digest. Export to PDF, CSV, or XLSX. Every output carries the citation trail.
6 authoritative sources. One view.
Full attribution and licence terms- Optikos Statistical Foundation LayerEuropeanUnion-PublicData
- Optikos Border Intelligence LayerEU-PSI-2019-1024
- Optikos Event Intelligence LayerCC0-1.0
- Optikos Flood Hazard LayerCC-BY-4.0
- Optikos Humanitarian LayerReliefWeb-Terms
- Optikos Infrastructure LayerODbL-1.0
Pricing
Three tiers. Monthly subscriptions available; multi-year optional.
Public regional data is accessible on the Explorer tier without charge. Professional and Institutional pricing reflects seat count, support response time, and data scope: the specifics are confirmed in conversation.
Optikos Explorer
Public regional data, the map, and the search.
- View public regional data
- API calls / day
- OpenAPI spec
- Seats included
Optikos Professional
Exports, briefings, saved views & watchlists.
- View public regional data
- View private (org-uploaded) data
- API calls / day
- CSV (per-region)
Optikos Institutional
All 6 AI products, bulk exports, team seats.
- View public regional data
- View private (org-uploaded) data
- API calls / day
- CSV (per-region)
Start with the map. No account required.
Public regional data is accessible without registration. When you need AI analysis, saved views, or exports, create an Explorer account: it takes 30 seconds and costs nothing.
- Browse 1,541 NUTS regions
- Inspect map layers and licences
- Read citation-grounded events
- Create an Explorer account at any time